
Fact Check: No, There Is Not A New Survey Showing Trans Identity Is Decreasing
The claim, which originates from far-right professor Eric Kaufmann, appears to have made a glaring error: the survey actually shows more people have come out, not fewer.

On Tuesday, far-right academic Eric Kaufmann published a new “analysis” through his so-called Centre for Heterodox Social Science and the outlet UnHerd, claiming that transgender identification in America is dramatically declining—a finding tailor-made for those who insist that being transgender is just a passing “fad.” Within hours, conservative leaders like Elon Musk and Matt Walsh were celebrating the supposed downturn as proof their anti-trans rhetoric was working. But as the data has now been reviewed by independent researchers, it turns out Kaufmann’s conclusion is based on a massive statistical error. When corrected, the numbers show the opposite of what he claimed: transgender and nonbinary identification in America has risen over the last two years as more people come out than ever before.
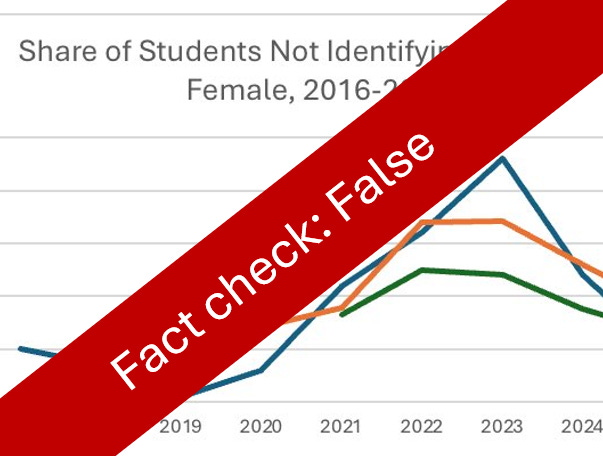
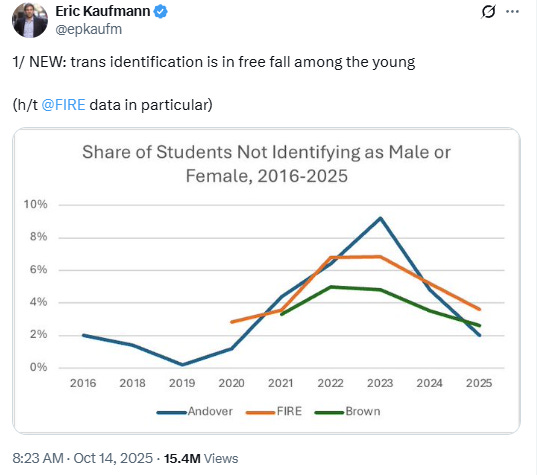
On Tuesday, Kaufmann posted a Twitter thread declaring that “trans identification is in free fall among the young.” The graph he used to prove it, however, was fundamentally flawed—it showed students who identified as “neither male nor female,” a category that excludes most transgender men and women. In other words, Kaufmann’s supposed evidence of a collapse in “trans identification” was actually a selective chart of nonbinary students, not transgender people as a whole. The distinction didn’t matter to the far-right echo chamber. Matt Walsh seized on the claim, boasting, “Transgenderism is effectively over. We destroyed it,” while Elon Musk reposted the graph to his hundreds of millions of followers, personally thanking Walsh for “playing a major role” in the so-called victory.
The error didn’t stop there. Researchers quickly discovered that Kaufmann’s graph—based on data from the Foundation for Individual Rights and Expression (FIRE), a right-leaning organization [Fire disputes this characterization| that studies campus speech—contained a fundamental methodological mistake. Data scientist Jacob Eliason was the first to spot it: Kaufmann had run his analysis using the raw survey responses rather than applying the weighting provided by FIRE to make the results nationally representative. Without weighting, the data dramatically misrepresented the population—and created the illusion of a drop where none existed. When Eliason re-ran the numbers correctly, the trend line flipped entirely, showing that the share of students identifying as neither male nor female had increased, not decreased. Kaufmann’s analysis, in other words, didn’t reveal a cultural shift—it revealed statistical malpractice.
You can see the unweighted estimates (dashed lines) versus weighted estimates (solid lines) here, revealing the increase in gender non-confirming individuals to 10% where it has remained stable since 2024:
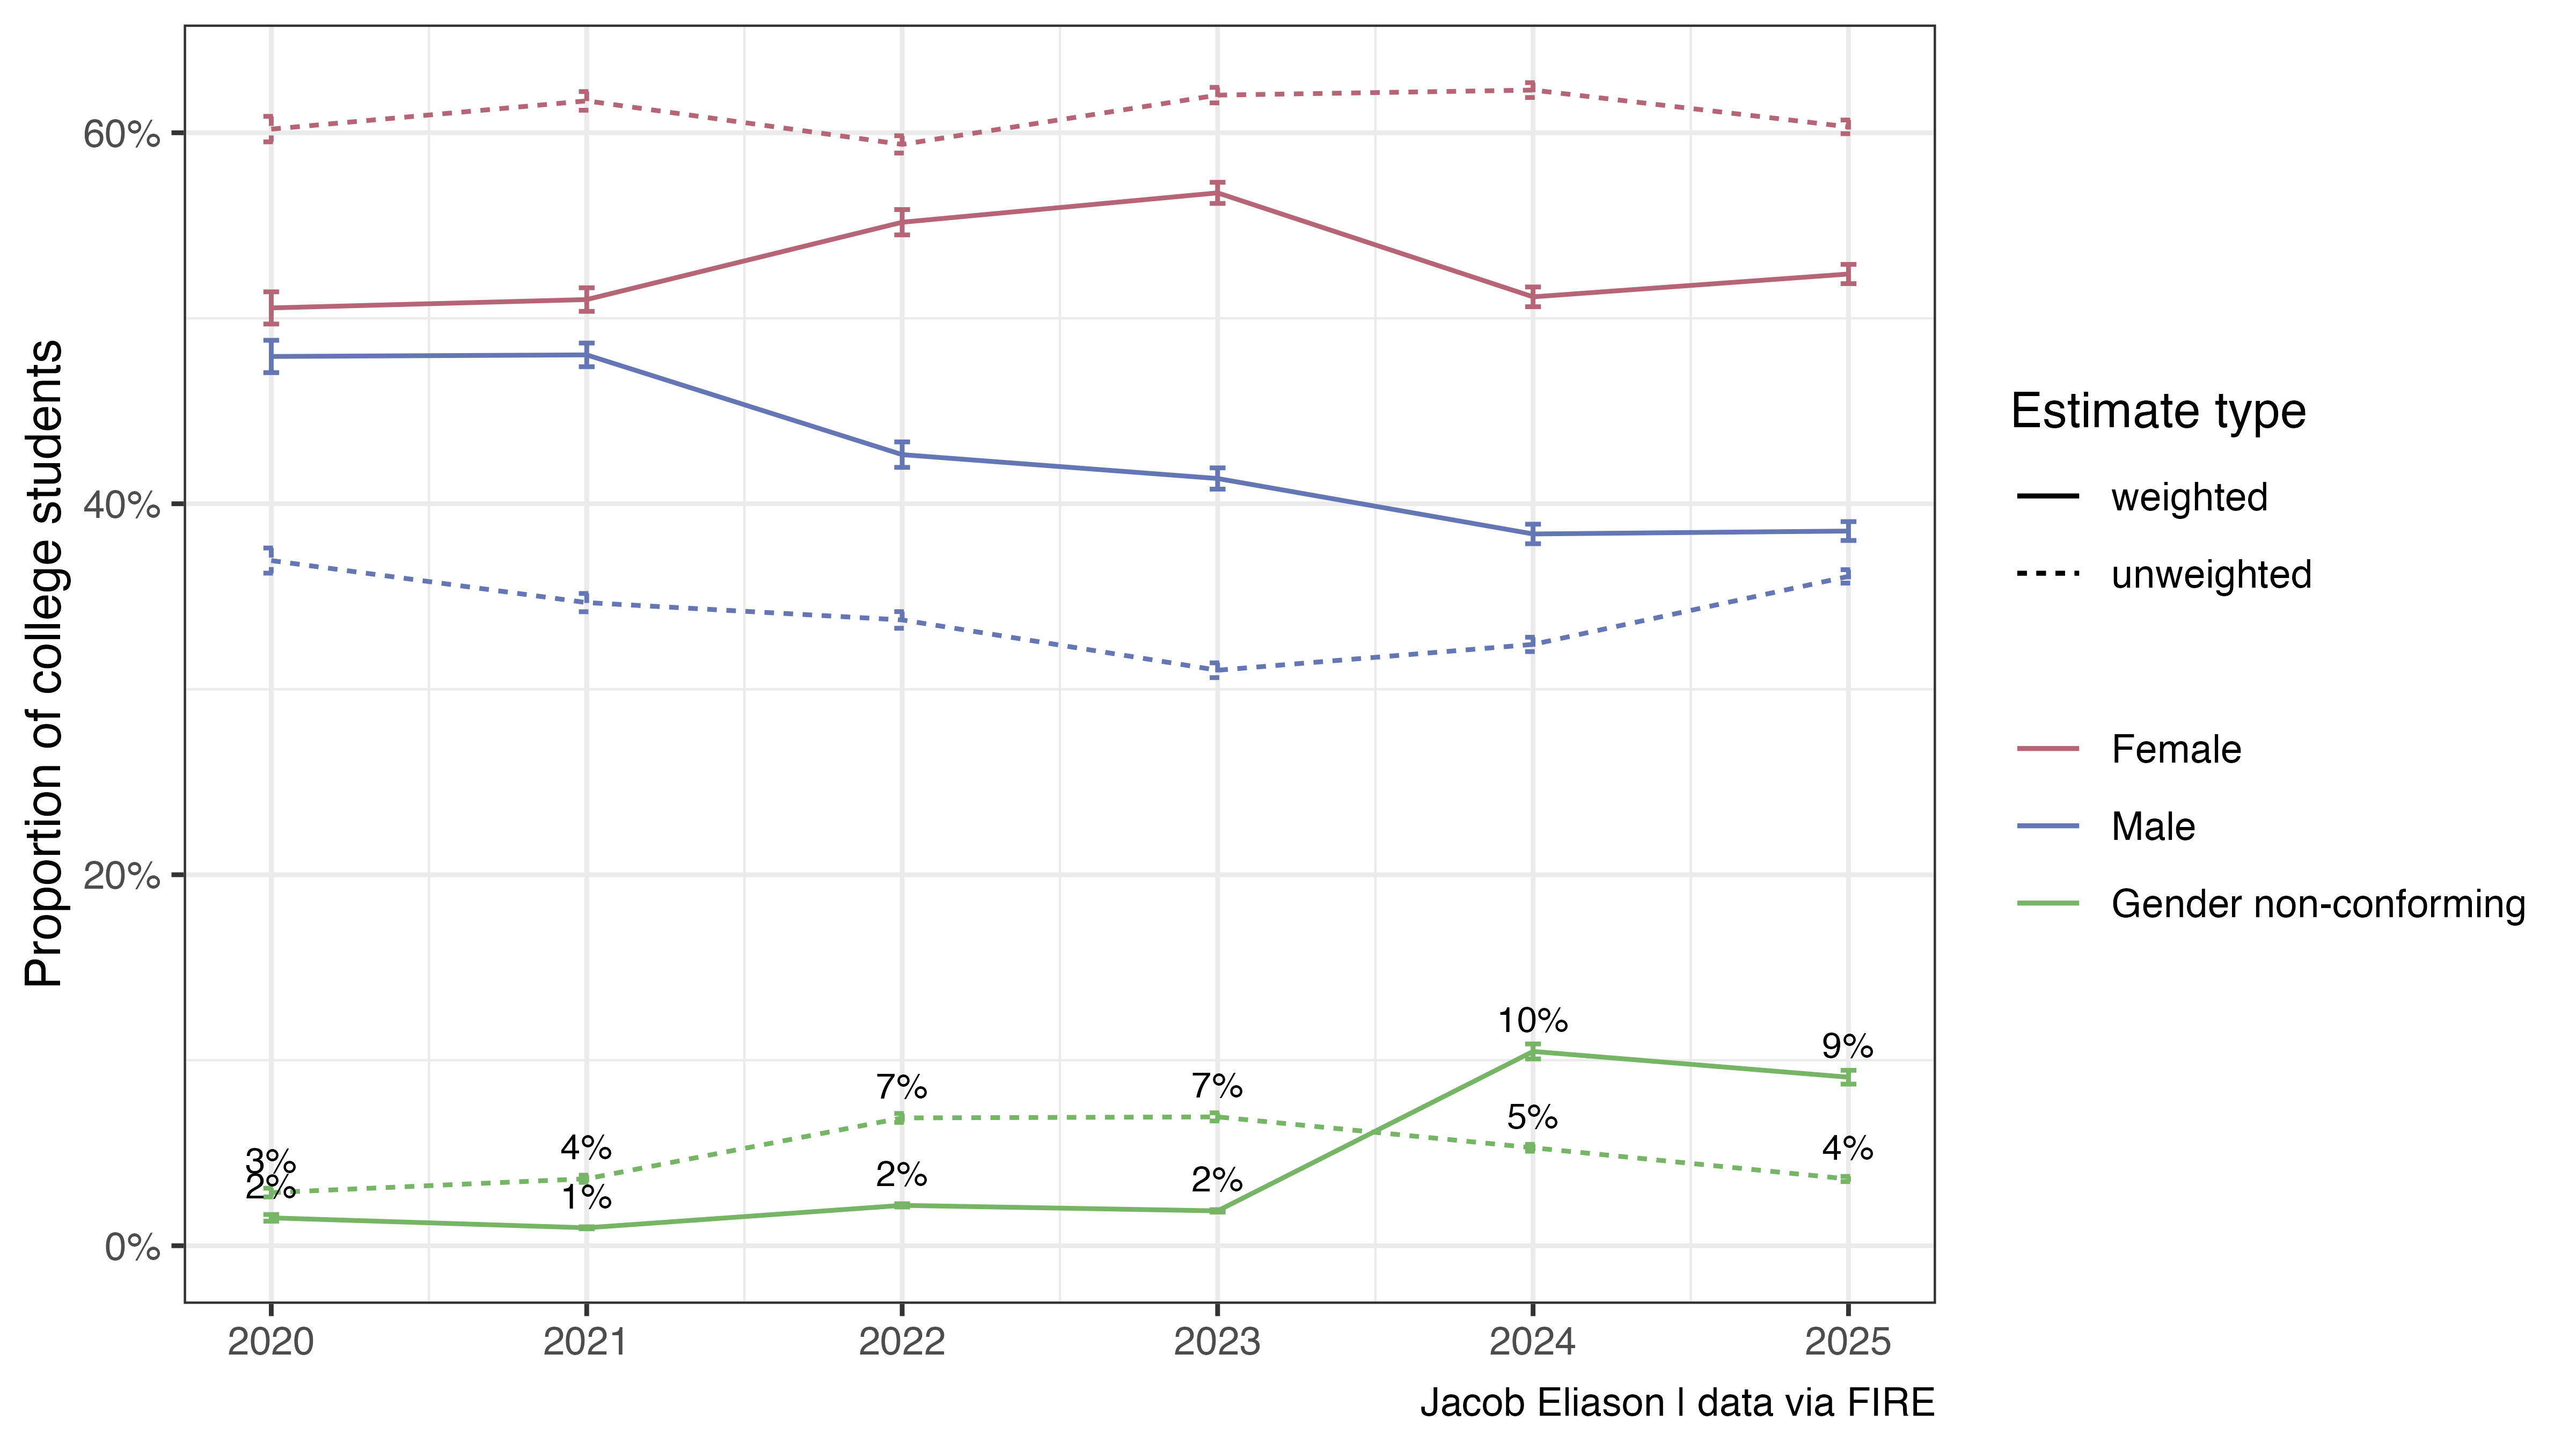
“Deriving causal claims about temporal effects from cross-sectional data is always challenging, but a good faith answer to the question of how the prevalence of gender non-conforming identification has changed over time is dead on arrival without survey weights,” says Eliason.
Multiple data scientists told Erin In The Morning this is a fundamental mistake. “To put it in context — every single political poll uses weighting. No one would pay for an unweighted one. I’d explain weighting as ‘being representative.’ Without weighting a survey is unrepresentative. For instance if you survey 40 people randomly, & then discover that 30 of them are male, that’s not representative of the population which is 49% male, 51% female. The bad graph doesn’t take that into account. So you have to weight the female responses heavier to reflect their representing half the population,” said Dr. Robert Bohan, who graduated from Trinity College Dublin with a diploma in advanced statistics studies.
A second way to see why weighting matters: imagine two annual campus surveys of gender identity. If one year the sample is drawn 90 percent from liberal-arts colleges and the next year largely from rural campuses, you could observe a drop in LGBTQ+ identification that reflects sampling differences, not any real shift in the population. That’s why FIRE—and every serious survey outfit—requires analysts to apply weights before drawing conclusions. Kaufmann didn’t, and the result wasn’t a discovery; it was an artifact of a basic statistical error.
When asked why he didn’t use the survey weights, Kaufmann offered no real justification—just a curt admission: “Yes no weights. I don’t believe weighting is appropriate for this kind of over time analysis.” Data scientists Erin In The Morning spoke with found that answer indefensible. In fact, weighting isn’t less important in longitudinal survey analysis—it’s more important. Because each year’s sample draws from a different mix of respondents, failing to weight the data means year-to-year comparisons reflect sampling quirks, not actual trends. Kaufmann’s defense only underscored what the experts were already saying: his analysis didn’t uncover a social phenomenon; it revealed a fundamental error in his own methodology.
To further confirm that Kaufmann’s lack of using survey weights would render the data in error, EITM contacted FIRE directly and asked if the data should be used with or without survey weights to do this kind of analysis. Speaking on behalf of the organization, Karl de Vries responded, “Hi Erin, FIRE strongly recommends applying the weights to all analyses, as this is a standard practice in survey research.”
Most reputable data analysis shows the opposite of Kaufmann’s claim: queer and trans identification continues to rise. The Gallup Poll—an industry standard in public opinion research which also uses survey weights—found that 1.3 percent of Americans now identify as transgender, up from 0.9 percent in 2023 and well above the roughly 0.5 percent reported in prior years. Generation Z accounts for much of this increase, with LGBTQ+ identification broadly climbing across all categories. Far from fading, the data suggests that as stigma decreases and visibility grows, more people feel safe enough to be honest about who they are.
Readers should be skeptical of any “research” that skips the scrutiny of independent peer review—especially when it comes from ideologically driven academics using partisan platforms to launder bad data into public discourse. Kaufmann, who has previously argued for so-called “white self-interest” and publishes through the vaguely named “Centre for Heterodox Social Science,” is not offering neutral scholarship—he’s doing politics dressed up as science. Data is powerful, but only as reliable as the person interpreting it. When fundamental errors go unchecked, misinformation spreads at lightning speed, shaping policy and public perception long before the truth can even lace up its shoes.
Update: Both Eric Kaufmann and Jacob Eliason have posted responses, which you can read at their respective links. Kaufmann doubles down on several fundamental errors that invalidate his conclusions. First, he continues conflating nonbinary identification with all transgender people—claiming they should trend together without evidence. This is like assuming everyone who drinks coffee also drinks tea because both involve hot beverages. Most transgender men and women would identify as “male” or “female” on surveys, not “neither,” making his proxy meaningless. Second, despite FIRE explicitly stating their data requires weights for valid analysis, Kaufmann insists his unweighted approach is superior—essentially arguing he knows better than the organization that collected the data. Finally, when caught ignoring survey weights, Kaufmann claims a “fixed-effects model” solves the problem, but this is statistical sleight of hand. As multiple data scientists have noted, fixed effects cannot magically make an unweighted sample nationally representative, especially with a survey that changes each year in composition, colleges surveyed, and in response rates among groups and within those colleges surveyed.
The deeper problem according to Eliason and other data scientists is that the FIRE survey was designed to measure campus free speech attitudes, not gender identity trends. It’s like using a thermometer to measure wind speed, then arguing about whether to read it in Celsius or Fahrenheit. Neither weighted nor unweighted FIRE data can reliably track transgender demographics over time because that’s not what the survey was built to do. When professional surveys actually designed to measure LGBTQ+ identity (like Gallup) apply proper methodology, they find transgender identification either stable or rising. Kaufmann’s entire analysis amounts to misusing the wrong tool for the job, then inventing post-hoc justifications when caught using it incorrectly. No amount of statistical gymnastics changes the fact that his original claim—that transgender identification has “halved”—was, in the words of data scientists, “dead on arrival.”
Even if the data were correct they are drawing the wrong conclusion from it. That isn't evidence that it's made up. If it were true then that would be evidence that the current hate campaign is pushing people back on the closet. They might still be trans but now unwilling to pursue it. Taking their data at face value paints them as cruel
Thank you for doing this work!